Paste any domain into a free technology profiler and you get its platform, frameworks, analytics and hosting in about five seconds. No account, no cost, nothing shady: the tools just read the code the site already sends to every visitor.
This guide shows the three free ways to do it, what each one is best at, and how to read the answers like an analyst instead of a tourist.
Why the tech stack is worth checking
A website's technology is a list of decisions someone made with real money. Read it and you learn things no about-page will tell you.
A rival on Shopify Plus with Klaviyo and an A/B testing tool is investing seriously in e-commerce. The same shop on a stock WordPress theme with one analytics tag is not.
Salespeople use stacks to find prospects who run a specific tool. Founders use them to copy what already works in their niche. We covered where this fits in a full teardown in our competitor analysis tools roundup.
The three free ways, compared
| Method | Best for | The free limit |
|---|---|---|
| PoweredBy | Full report + history of changes | None: no account, no caps |
| BuiltWith | A second opinion, deep category detail | Free single-site lookups; lists and exports are paid |
| Wappalyzer | Checking sites as you browse | Free extension; about 50 site lookups a month on the web tool |
| Reading the source yourself | Verifying, and sites profilers miss | None, just your time |
Step 1: run the domain through PoweredBy
Start with PoweredBy. Type the domain and you get every detected technology grouped into categories: CMS, frameworks, payments, email, analytics, CDN and more than 50 others.
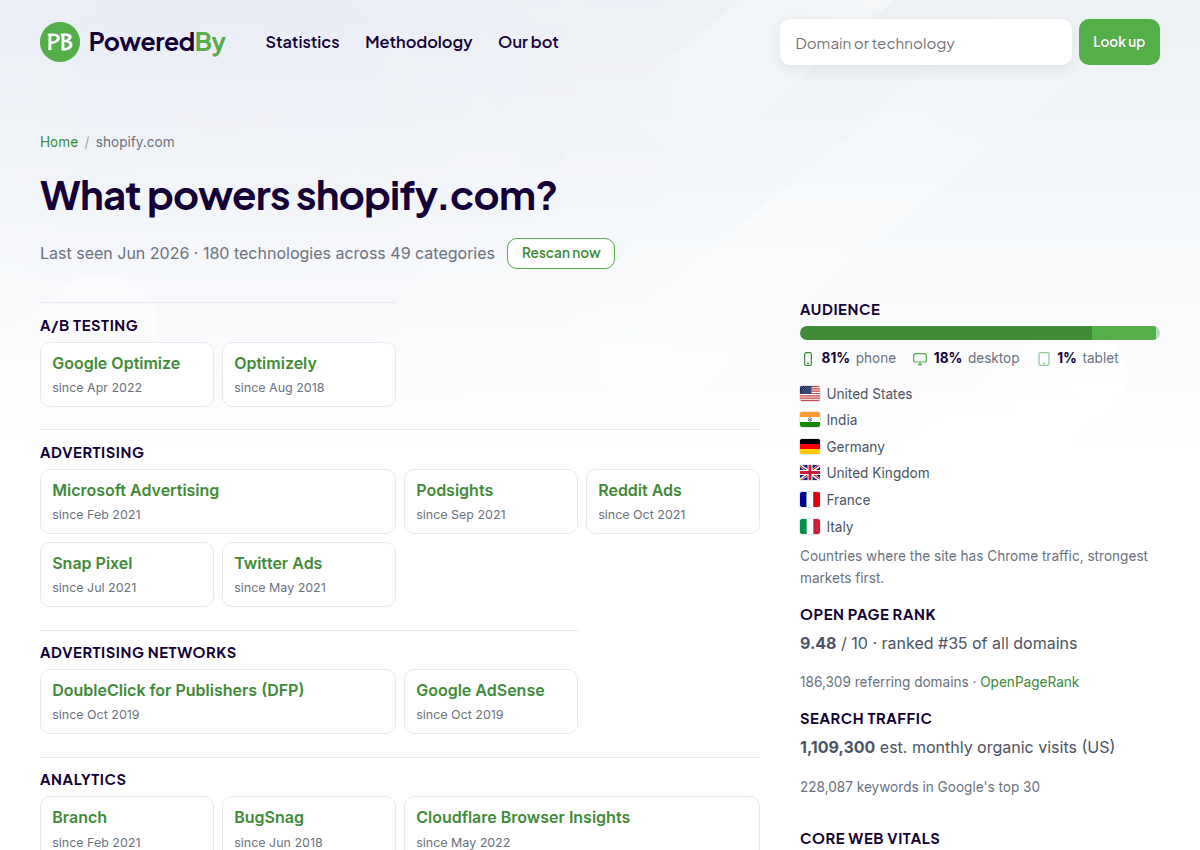
Two details make it the best first stop. It is completely uncapped with no signup, and each technology shows when it appeared, with history back to 2018.
That date column matters more than it looks. A payment provider added last month is news. One added in 2019 is furniture.
Full disclosure: PoweredBy is built by the Keywords Everywhere team. Judge it the empirical way, by reading a live report yourself.
Step 2: cross-check with BuiltWith
No detector catches everything, so verify anything important with a second source. BuiltWith has profiled websites since 2007 and its free lookup covers any single domain.
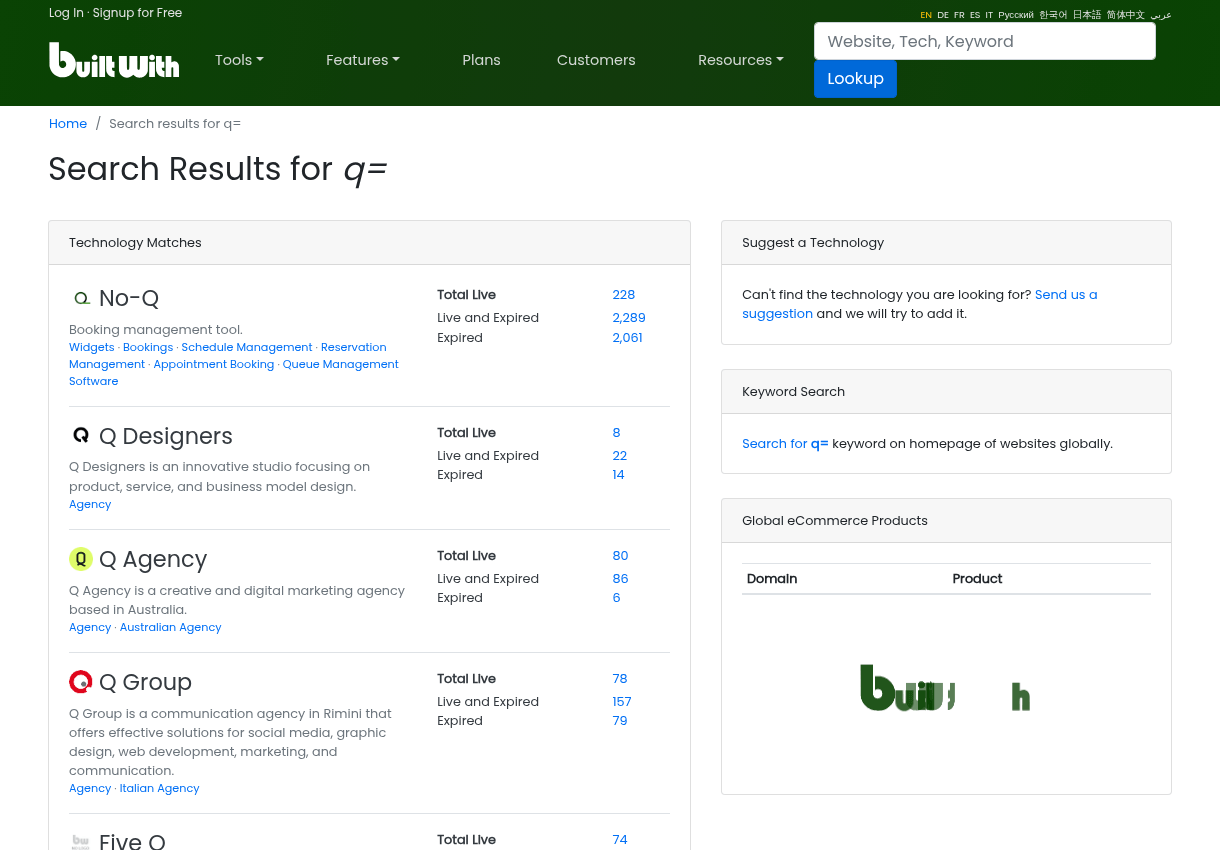
Its paid plans start at $295 a month, but those buy lead lists and market data for sales teams. For checking one site at a time, the free lookup is all you need.
When two profilers agree, trust the answer. When they disagree, the source code settles it, which is step 4.
Step 3: install Wappalyzer for browsing
Wappalyzer's free browser extension shows the stack of whatever site you are on, one click from the toolbar. It turns tech checking into a background habit.
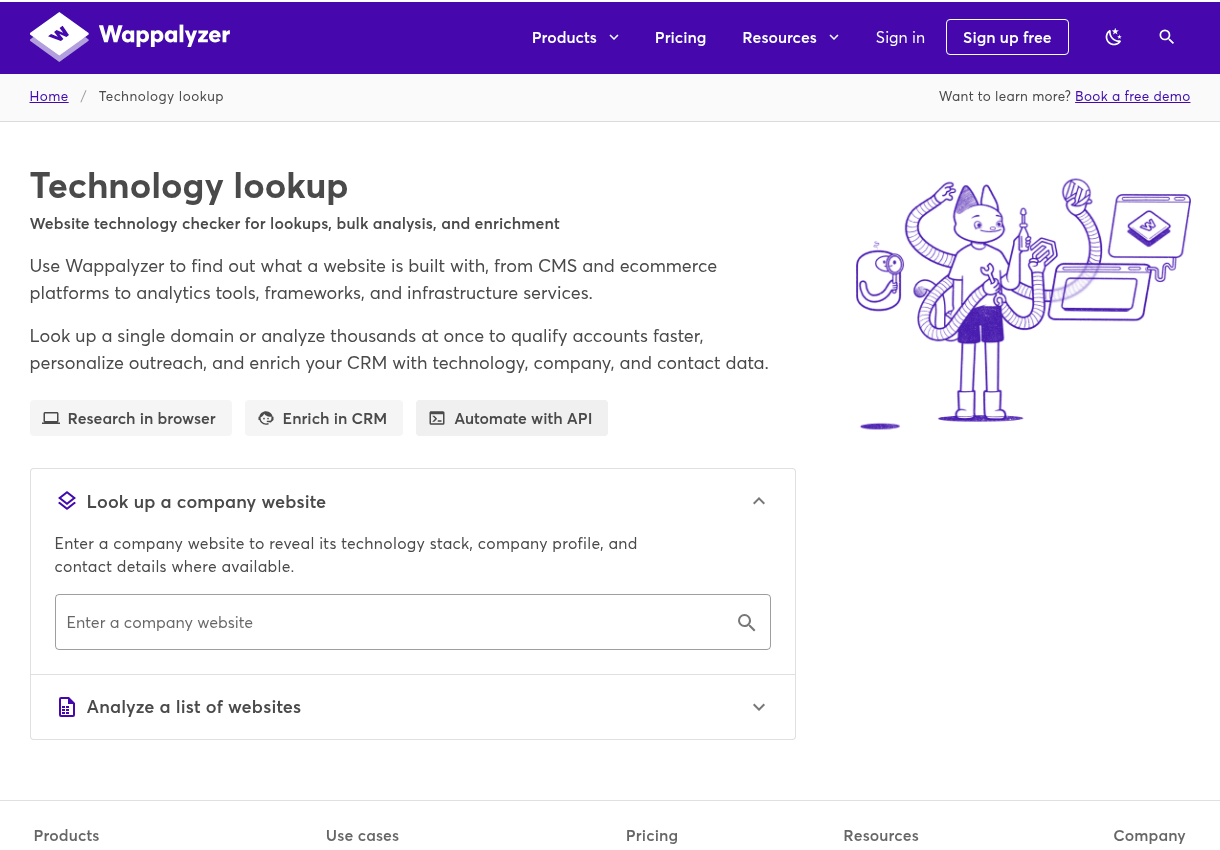
The extension is free without an account. The website's lookup tool allows about 50 checks a month free, and its paid tiers (from $250 a month) sell bulk lookups and lead lists, the same market BuiltWith serves.
Step 4: read the fingerprints yourself
Profilers work by matching fingerprints in the page source. You can read the loudest ones yourself with right click, View Page Source, and Ctrl+F.
These five fingerprints identify most of the web:
| Search the source for | It means |
|---|---|
wp-content | WordPress |
cdn.shopify.com | Shopify |
__NEXT_DATA__ | Next.js (React) |
gtag.js or googletagmanager | Google Analytics or Tag Manager |
static.wixstatic.com | Wix |
Manual checking is also the tiebreaker when profilers disagree. The source code never lies about what loads.
Step 5: read the stack like an analyst
The list is the easy part. The value is in what the choices mean.
The history view is where strategy shows. A competitor who added a subscription-billing tool last quarter is telling you their roadmap without a press release.
What no profiler can see
Detection reads what the browser receives, so purely server-side choices stay invisible. The database, the internal APIs and any custom backend code do not fingerprint.
Absence of evidence is not evidence of absence. If a report shows no analytics at all, assume server-side tracking before assuming none.
The one-line takeaway: run the domain through PoweredBy for the full stack and its history, confirm anything important with BuiltWith or the source code, and read the choices as strategy: platform = ambition, marketing stack = sophistication, changes = roadmap.