Companies announce their strategy in code months before they announce it in words. A new billing tool, a new analytics suite or a platform swap is money already spent, which makes it the most honest signal a competitor emits.
This guide decodes the common migrations: what each change means, and how to spot them free.
Why migrations beat press releases
Talk is cheap and roadmap slides are cheaper. Replatforming is not: it costs engineering months, retraining and risk.
So when a rival's stack changes, someone with budget authority decided the change was worth real pain. You are reading a signed decision, not an aspiration.
The decoder table
| The change | What it usually means |
|---|---|
| WordPress to Next.js or similar | Engineering investment, performance and conversion push |
| Custom platform to Shopify | Simplifying, cutting maintenance cost, moving faster |
| Adding subscription billing | Recurring-revenue model incoming |
| Adding a CDP or product analytics | Data maturity: they will optimize harder from now on |
| Adding A/B testing or session replay | A conversion team now exists |
| Adding e-commerce email/SMS tools | Retention and lifetime-value push |
| New enterprise support desk | Support volume grew: customer base is scaling |
| New payment providers by region | International expansion, market by market |
None of these is certain alone. The craft is reading clusters and sequences, which is where timelines come in.
Read sequences, not snapshots
A single added tool is a data point. Three changes in six months is a narrative.
Sequences also expose seriousness. A tool added and removed within two months was a trial that failed. A tool that persists earned its keep, the same read-the-survivors logic we used on competitor ads.
How to spot migrations free
You need detection with dates, not just a current snapshot. PoweredBy shows when each technology was first seen on a domain, with history back to 2018, free and uncapped.
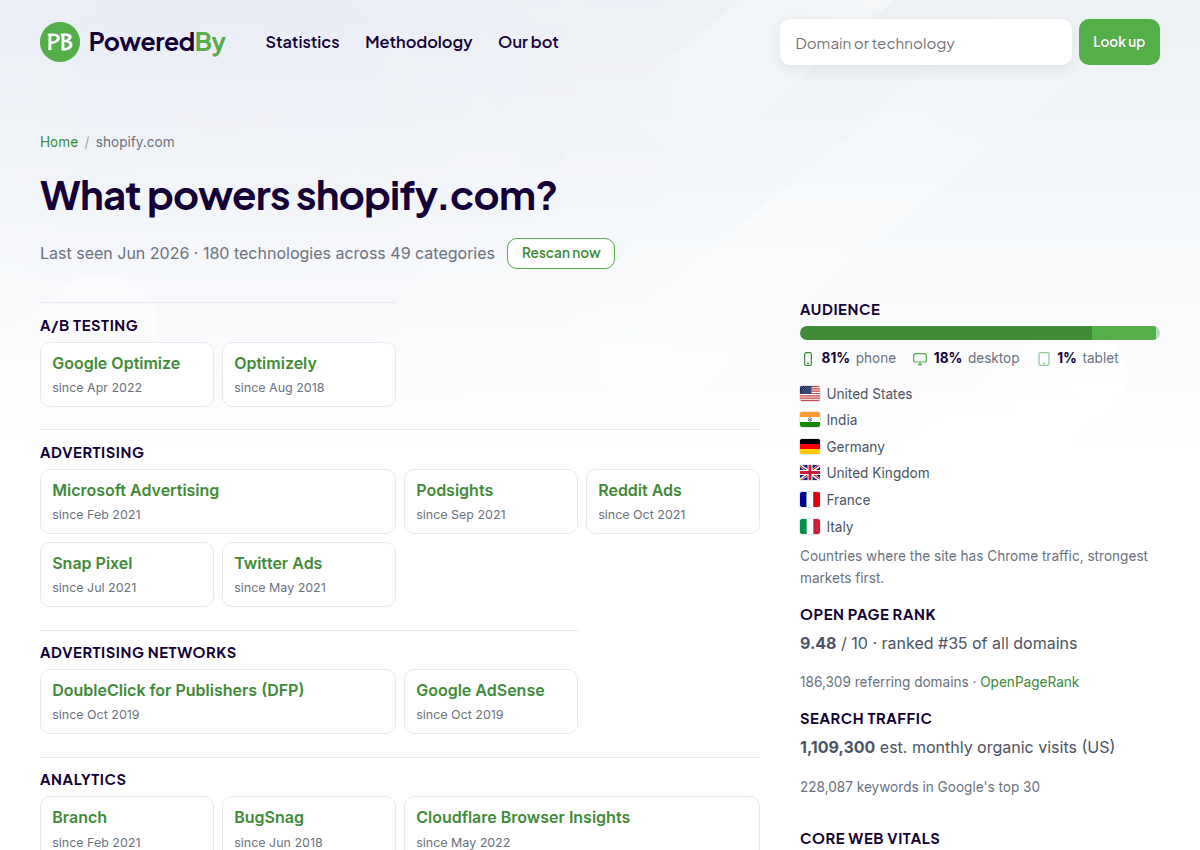
The routine: pull the report for each main rival quarterly, note anything new or gone, and ask what decision would explain it. Our tech-stack guide covers the reading skills, and the profiler comparison covers the alternatives.
For rivals that matter most, add their key pages to change monitoring. Frontend migrations almost always ship visible page changes too.
Calibrating the signal
Not every change deserves a strategy memo. Weight them by cost and commitment.
One caution from the other side of the telescope: absence is not proof. Server-side tools never fingerprint, so a rival with an invisible data stack may still be highly instrumented.
The quarterly migration review
Fifteen minutes per quarter per rival: pull the technology report, sort by date, note additions and removals, and write one sentence about what story the changes tell.
Most quarters the sentence is "nothing changed". The quarter it is not, you will know about their strategy shift months before their announcement, which is the entire point.
The one-line takeaway: stack changes are strategy spending its budget in public. Check rivals' technology reports quarterly, read sequences instead of single tools, and weight each signal by what it cost them to ship.